
Significant growth in TV OTA, TV Digital, and CTV/OTT fueled by political and other local…
Online Properties and Political Ads Lift Local TV Station Over-The-Air Revenues by 13.2% in 2012
Transaction volumes almost double in 2012, while values struggle to keep pace
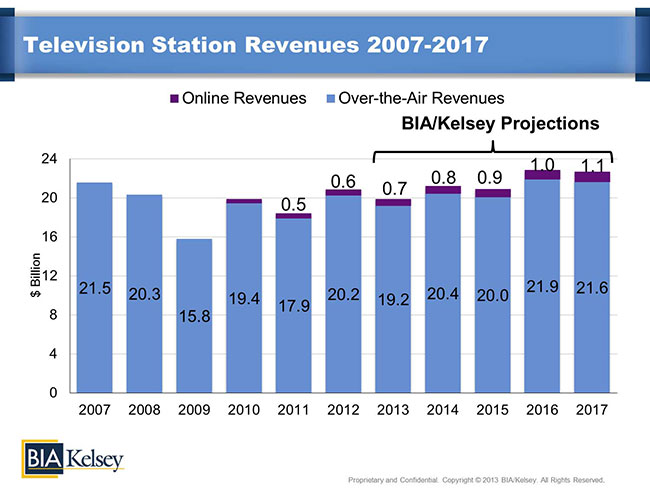
CHANTILLY, Va. (April 25, 2013) – The 2012 election season provided a boost to local television station revenues, according to BIA/Kelsey, advisor to companies in the local media industry. BIA/Kelsey’s MEDIA Access Pro proprietary database and the first edition of the firm’s quarterly Investing In Television® Market Report reveals the industry generated $20.8 billion in revenues in 2012, a 13.2 percent increase over 2011, mainly from over-the-air advertising and also from online properties.
According to the report, the number of stations sold in 2012 was 97, nearly doubling the 50 transactions of 2011. However, the average sales price decreased by 11.3 percent. In 2012, stations sold were valued at a combined $1.9 billion, whereas in 2011, the 50 stations sold were valued at $1.1 billion. BIA/Kelsey attributes this to strategic acquisitions of low revenue stations by broadcast companies anticipating the upcoming FCC reverse auctions. In 2013, the volume is already ahead of last year and is expected to continue on this steady pace.
“Last year revenues accelerated quicker than we had anticipated and, overall, political advertising was the driving force for television stations, as is typical for a presidential election year,” said Mark Fratrik, vice president and chief economist, BIA/Kelsey. “We expect the pace to normalize this year, but continue its upward trend to pre-recession numbers, in part, due to online revenues. While stations are part of the advertising mix, they continue to prove themselves for delivering audiences through over-the-air programming and, lately, the growth of quality online video offerings that compete with other services.”
As illustrated in Investing In Television® Market Report, Fratrik pointed to specific markets that benefited in 2012.
“For example, the Wisconsin markets, which had a recall election and became a battleground state in November, saw, on average, more than a 40 percent increase in advertising revenues,” he said. “Similarly, the Ohio markets, also a hotbed of tight campaigns, saw, on average, a nearly 38 percent increase. Other markets with tight campaigns saw similar increases.”
The chart below represents BIA/Kelsey’s five-year forecast for the television industry broken down by over-the-air and online:
Investing In Television® Publications and MEDIA Access Pro™
A comprehensive profile of all 210 television markets (plus Puerto Rico) and television market projections through 2017 are available in the first-quarter edition of Investing In Television® Market Report and the 2013 Investing In Television® Ownership Report, published by BIA/Kelsey. Individual television market reports are now available on demand with station competitive and performance information, including estimated advertising revenues, technical data, ownership and acquisition information, and more. BIA/Kelsey also publishes investment reference guides and provides data services for the television and radio industries.
Information from BIA/Kelsey’s Investing In publications is also accessible through the company’s proprietary broadcast industry database, MEDIA Access Pro™. Relied upon by top media companies, investment and lending institutions and government regulatory agencies, MAPro offers more than 1,200 fields of data on more than 30,000 broadcast and newspaper organizations in the United States, Canada and Mexico. Subscribers use the database to view data by local markets and conduct their own analysis and research for spectrum analysis and financial and operational decision making. More information about MAPro can be found on the BIA/Kelsey website at https://www.bia.com/Broadcast-Media/Media-Access-Pro.
Media Ad View Reports
Covering 12 media, 12 ad categories and 94 business categories, BIA/Kelsey’s Media Ad View reports track local advertising spending by media for the most recent year and for five years out (2012-2017) for every local market. Markets are organized by the 362 Core Based Statistical Areas (CBSAs) or TV/Radio markets.
For more information on BIA/Kelsey’s Investing In publications or Media Ad View reports, call (800) 331-5086 or email info@biakelsey.com.
About BIA/Kelsey
BIA/Kelsey advises companies in the local media space through consulting and valuation services, research and forecasts, Custom Advisory Services and conferences. Since 1983 BIA/Kelsey has been a resource to the media, mobile advertising, telecommunications, Yellow Pages and electronic directory markets, as well as to government agencies, law firms and investment companies looking to understand trends and revenue drivers. BIA/Kelsey’s annual conferences draw executives from across industries seeking expert guidance on how companies are finding innovative ways to grow. Additional information is available at https://www.bia.com, on the company’s Local Media Watch blog, Twitter (http://twitter.com/BIAKelsey) and Facebook (http://www.facebook.com/biakelsey). Stay connected by subscribing to the firm’s bi-monthly newsletter.
For more information contact:
MacKenzie Lovings
BIA/Kelsey
(703) 818-2425
mlovings@biakelsey.com
Eileen Pacheco
For BIA/Kelsey
(508) 888-7478
eileen@tango-group.com
Robert Udowitz
For BIA/Kelsey
(703) 621-8060
rudowitz@biakelsey.com